Would you like to make this site your homepage? It's fast and easy...
Yes, Please make this my home page!
Hurricane Dennis and
Floyd (1999)
http://www.ametsoc.org/dstreme/learn/a_act.html
(The above are excerpts from
the preliminary report on the 1999 Atlantic Basin hurricane season by the
National Hurricane Center. The complete report is available at: http://www.nhc.noaa.gov/archive/1999/tws/MIATWSAT_nov.html.)
 Dennis
did its greatest damage after weakening to a tropical storm while off the
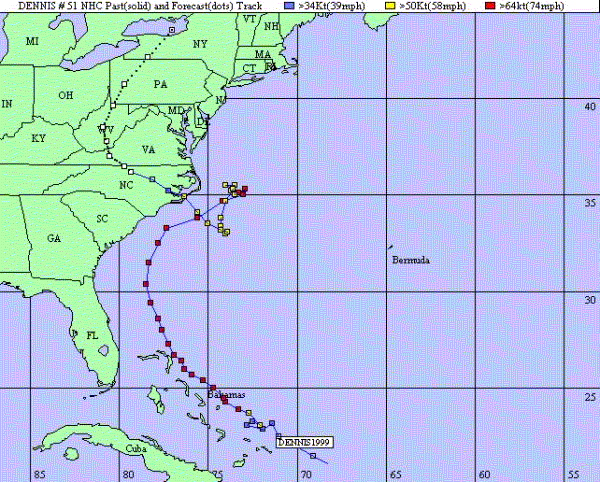
North Carolina coast. Image 1 is a map of the track of Dennis from 24 August
to 7 September 1999 (courtesy of the NWS office in Wilmington, NC) showing
6-hourly locations of the storm center. Off the coast of North Carolina,
Dennis took a [(straight-forward) (winding)] course along its path. This
path probably [(did) (did not)] make an easy task for forecasters.
Dennis
did its greatest damage after weakening to a tropical storm while off the
North Carolina coast. Image 1 is a map of the track of Dennis from 24 August
to 7 September 1999 (courtesy of the NWS office in Wilmington, NC) showing
6-hourly locations of the storm center. Off the coast of North Carolina,
Dennis took a [(straight-forward) (winding)] course along its path. This
path probably [(did) (did not)] make an easy task for forecasters.
As Dennis
finally came onshore in North Carolina on September 4th, the greatest height
of the storm surge would have been expected
to occur to the [(northeast) (southwest)] side of the landfall position
on the coast.


-
Having weakened to a tropical
storm, the greatest danger of Dennis to inhabitants well inland would probably
have been [(strong winds) (high storm surge) (heavy rainfalls)].
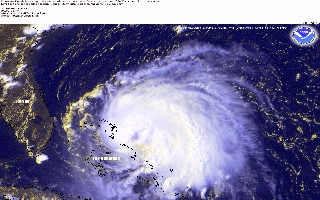
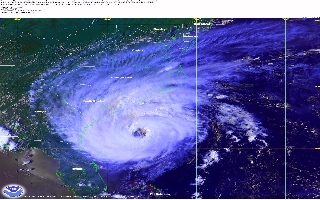
 Image 2 is the
track of Floyd.
Floyd made landfall near Cape Fear, NC, on September 16th as a category
two hurricane. Within a 2-week period, residents of eastern North Carolina
[(were) (were not)] affected by the passage of both Dennis and Floyd. The
greatest danger to the inhabitants of central North Carolina from Floyd
would have been the [(strong winds) (high storm surge) (heavy rainfalls)].
-
Compare the tracks of Dennis and Floyd. Considering
the direction and location of the tracks and the coastal population centers
of the United States, [(Dennis) (Floyd)] posed the greater threat to the
most people and property along the East Coast.
Early season
rains in central and eastern North Carolina made soils in that area wet
as a prelude to the later heavy rains that were brought by the tropical
storms. The relatively flat topography inhibited the subsequent drainage
leading to the disastrous and prolonged flooding that devastated much of
North Carolina. (Ironically, at the same time, other areas of the Southeast
suffered from drought conditions.)
II. This activity is from the
DataStreme Project [http://www.ametsoc.org/dstreme/learn/b_act.html]
Under the
"United States Weather" section, third subheading on the Junction Homepage,
titled "Radar", click on the "MSNBC
Intellicast Weather".
-
Observe the 3-part shadings scale
below the radar map. A unique feature of the Intellicast radar display
that is not shown on the DataStreme maps with radar echoes, is the indication
of precipitation [(location) (type - rain/mixed/snow) (intensity)].
Some of
the latest versions of browsers, such as Netscape 3.0, allow you to interactively
select regional radar displays from the map. Also, if your browser is capable,
this site allows you to create a radar animation loop. Another menu choice
above the map ("NEXRAD Imagery") will allow a choice of individual radar
station views of reflectivity
and radial velocity.
Return to
the DataStreme Junction
Homepage.
You can hit the BACK
button
until you are back at the DataStreme Junction page, retype the address,
or go to your bookmark or favorite place link. Next, still under the "United
States Weather" section, choose the "Station Data" link (2nd bullet item)
to "Atmospheric Science at the University of Wyoming".
The Wyoming
site is a great source for surface (and other) weather data in a variety
of formats. Let us choose to find current observational data for Birmingham,
Alabama. (This city, as with many, is not plotted on most DataStreme surface
maps or given in a meteogram.)
-
Choose "Listings of surface conditions
by state". Under the US map displayed, enter state: AL, and hit the "Submit
Request" button, or click on the map at Alabama. On the page that appears,
on the station list, click the "KBHM" identifier. You have a choice of
a time series list of observations or a meteogram display. The list shows
the surface observational data for Birmingham for the preceding [(one)
(ten) (twenty-six)] hour period.
Then use the BACK button to return
to the options list page and click on "Meteogram" link. In this way you
can also get a meteogram plot in a format similar to that of DataStreme.
In this way you can find data for every location in the US.
A source for severe weather data
is the National
Weather Service homepage: http://iwin.nws.noaa.gov/iwin/graphicsversion/main.html,
the Junction link under "Watches and Warnings", Interactive Weather Information
Network. Below the panel with the lightning picture is a listing of the
states currently under severe weather warnings. Clicking on one of those
links will bring up the NWS text of the specific weather statement.
-
Choose the panel button, "Local
Weather" next to the lightning picture on the page. A US map also shows
the states currently under an active warning using the color [(red) (yellow)
(blue)].
IV. Web Resources
^TOP?
^TOP?
< Go
to Sister Dianne's Earth and Space Science Homepage
< RARE
Club
< GO
to Eat a Mountain et.al. Activities


 Bye for now, and Thanks for joining us !!